Introduction To Stock Portfolio Organizer
Stock Portfolio Organizer is a powerful and easy to use stock portfolio management and tracking application. It is great for both tracking your investments (including income such as dividends) and following changes in stocks you are interested in. Compared to an excel spreadsheet or you broker it saves time and provides many useful performance metrics and information that you may need.
In this section we will cover some of the key features of Stock Portfolio Organizer so you can get started with the program as quickly as possible.
First Time You Run Stock Portfolio Organizer
When you first open Stock Portfolio Organizer, you should see a window similar to the following:
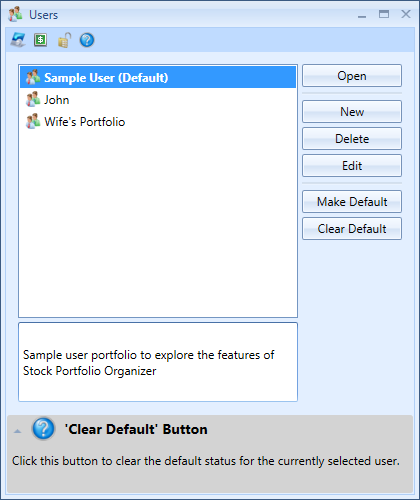
This is the list of users in the program. Each user can have an unlimited number of accounts, trades and groups for those trades (to compare performance etc). Multiple different portfolios can easily be managed with a single user account by putting trades into different groups and separate transaction accounts for the different portfolios. Most users of Stock Portfolio Organizer will only ever need to create a single user account to manage the family portfolio so it is recommended that you create a user and make it default so that this window doesn’t appear each time the application is opened.
Main Stock Portfolio Organizer Window
When a user is opened, you should see a window similar to the one below:
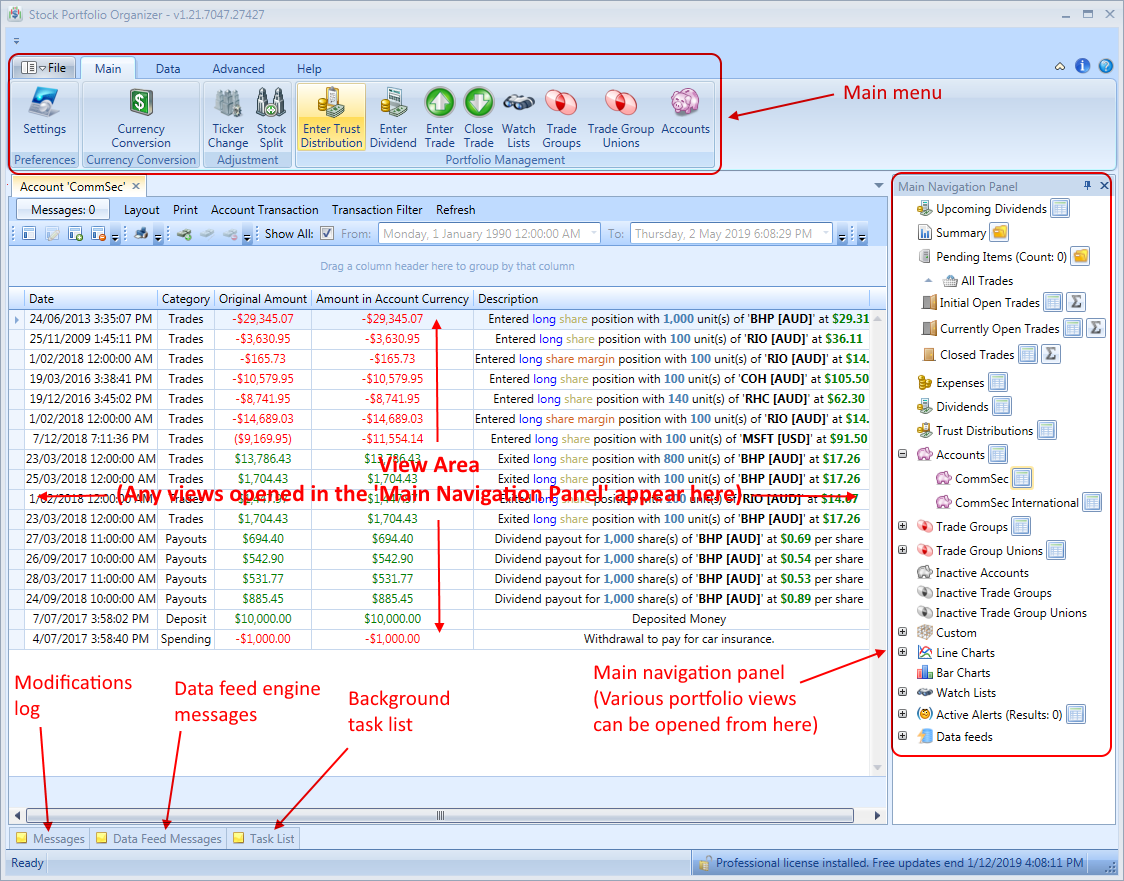
This is main Stock Portfolio Organizer window. There are three main sections in the main window:
Main Menu – The main menu contains all the buttons for the various administrative functions such as recording a new trade or creating a new account.
Main Navigation Panel – The main navigation panel is the area where you can open various views relating to your portfolio. For example, under accounts you will see a list of all accounts. Opening an account view will display a list of all transactions in that account.
View Area – This is the area where the various views that are opened in the ‘Main Navigation Panel’ will appear.
First Time Opening A New User
There are a few things you will need to do before you can start adding/importing trades into the program. Firstly, you will need to create an account and secondly, you will need to create a brokerage formula.
Accounts are used to record debit and credit transactions. When you purchase shares, you will need to select which account the funds came from. When you sell shares, you need to specify which account the proceeds should be deposited to.
Brokerage formulas, as the name suggests, calculate various trade expenses such as brokerage and tax. They serve two purposes. Firstly, they greatly speed up data entry as they can automatically calculate brokerage costs for a trade so you don’t need to enter them manually. Secondly, they are used to calculate the brokerage for unsold trades so you can see the real profit/loss with brokerage factored in. You can create an empty brokerage formula to get started as quickly as possible and edit it later when you are more familiar with the program.
Once you have added an account and brokerage formula you can begin entering or importing your trades.
What is a Account?
As mentioned earlier, an account is used to record debit and credit transactions. Each trade needs to specify the debit/credit account. You can also enter miscellaneous debits and credits to an account. To see the list of transactions for an account, simply navigate to the account you are interested in in the ‘Main Navigation Panel’ and open the view associated with it. You can learn how to add an account here.
What is a Trade Group?
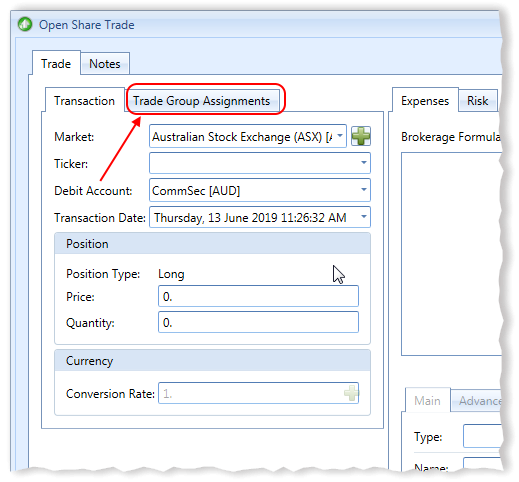
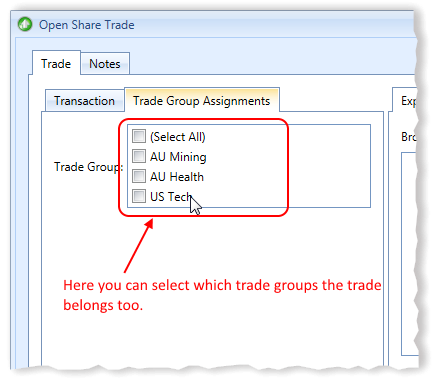
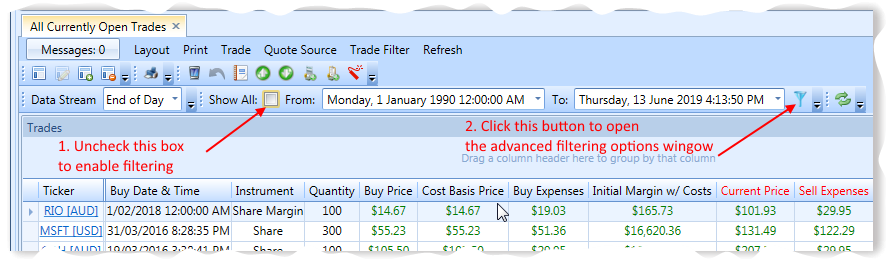
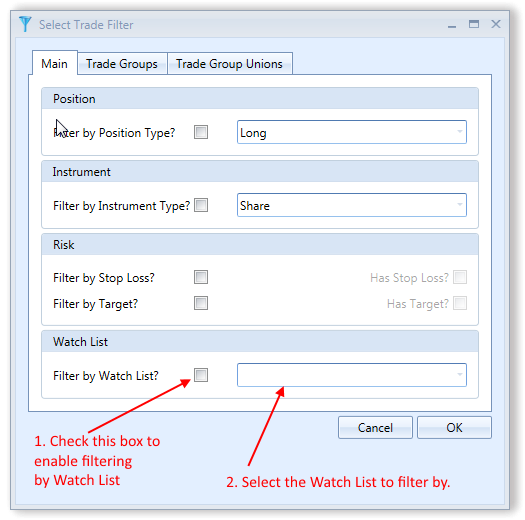
By default in Stock Portfolio Organizer you can see various performance metrics only for all trades in the summary view. You can apply various filters to be able see performance metrics for only trades you are interested in but this has its limitations especially if you are managing more than one portfolio in the same user. This is where Trade Groups come in. Trade Groups, as the name suggests, allow you to assign trades to various groups and analyze each group individually. Trade Groups provide a very flexible way to to organize a portfolio and provide a way to compare performance metrics of different portfolios. You assign, which group a trade belongs to in the trade entry window. Each trade can be assigned to as many groups as needed. There are no limitations.
What is a Trade Group Union?
Trade Group Unions provide a way for you to create groups of Trade Groups. For example, let’s say you have organized your trades into the following groups: ‘Coal’, ‘Lithium’, ‘Oil’, ‘Health’ and ‘Banks’. Then at a later date you wanted to analyze the performance of your trades in the mining sector to the rest of your portfolio. This could easily be accomplished by creating two Trade Groups Unions. One comprising of ‘Coal’, ‘Lithium’ and ‘Oil’ and the other comprising of ‘Health’ and ‘Banks’.
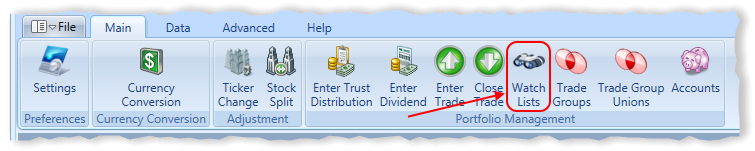
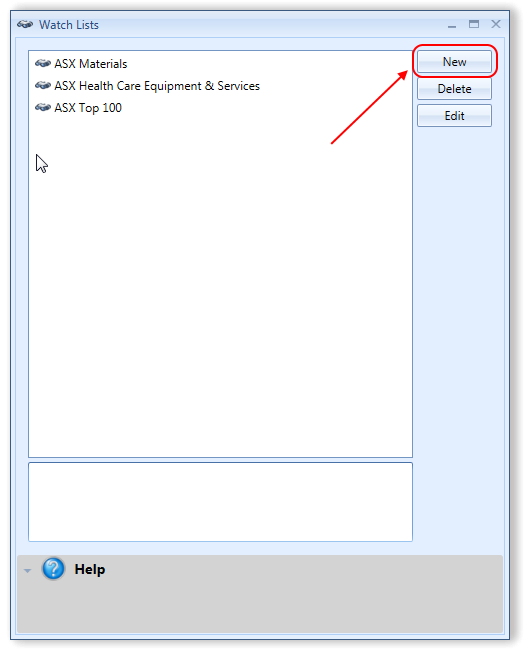
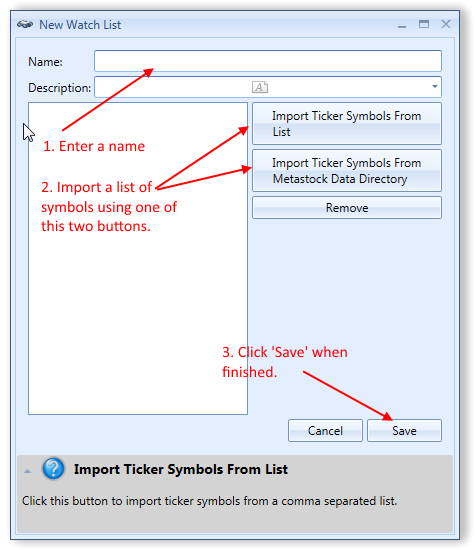
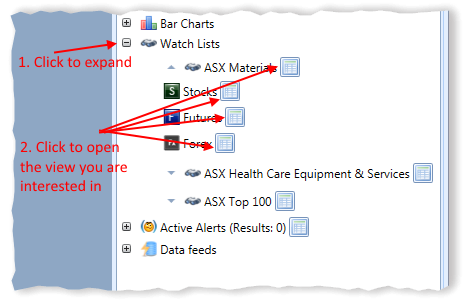
What is a Watch List?
A Watch List is a collection of securities such as stocks, mutual funds, ETFs or options. Each Watch List offers many different ‘views’ of your data to give you more perspective. Watch lists have a standard ‘Prices’ view where you can see the current prices for the securities in which you are interested in. Also, depending on the view, they also have a ‘Fundamentals’ view where you can get a quick look at some basic valuation information such as P/E, 52-Week High, and Dividend, among many others. Watch Lists can also be used to analyze performance of a certain groups of securities. For example, a watch list of the ‘ASX 100’ can be used to analyze how trades that appear in the ‘ASX 100’ are performing.
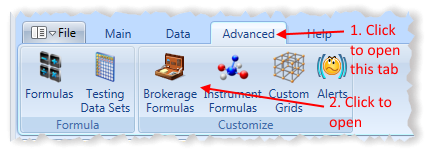
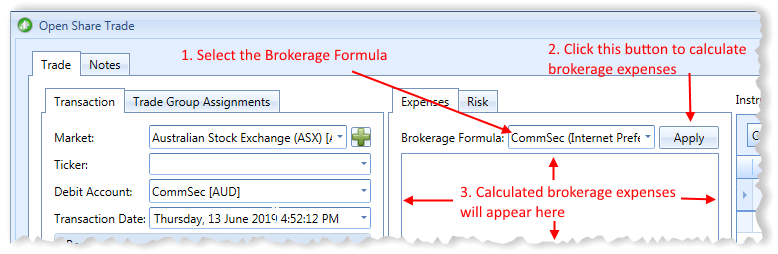
What is a Brokerage Formula?
A Brokerage Formula allows you to quickly and easily calculate the expenses associated with a trade with a simple click of a button. It is also used to calculate true profit/loss for a currently open trade by subtracting the computed sell expenses from its current market value. If you want to enter brokerage expenses manually, you can by creating an empty brokerage formula and entering expenses manually.
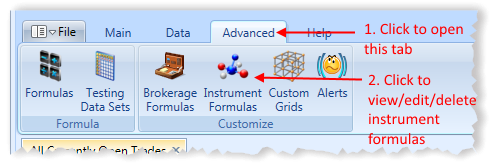
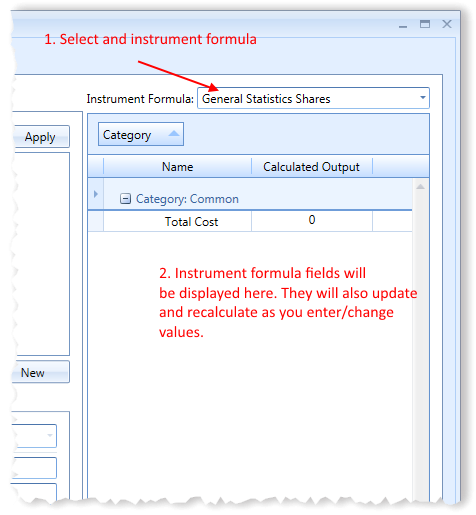
What is a Instrument Formula?
Instrument Formulas allow you to calculate and display information when entering a trade. When, for example, you are entering the quantity and price price of a trade any Instrument Formulas selected receive this data and can calculate and display various useful metrics or information. Stock Portfolio Organizer already includes a couple of useful Instrument Formulas that do risk management & position sizing.
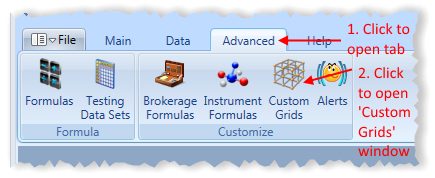
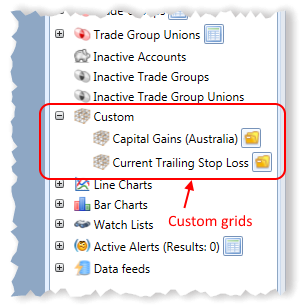
What is a Custom Grid?
Many of the views of your data in Stock Portfolio Organizer are displayed in a grid or spreadsheet style view if you are familiar with excel. For example, the list of account transactions or list of currently open trades. Custom Grid allow you to create you own views that display data in a grid. Custom Grid have access to all the underlying data of accounts, trade groups etc. You are limited only by your imagination.
What is a CSV Data Template?
Most brokers let you download a list of trade transactions in the CSV (short for Comma Separated Values) file format. This format can be opened in excel or imported into Stock Portfolio Organizer. Since the format of this data varies from broker to broker, you need to specify what data each column represents and how it is formatted so that it can be imported into Stock Portfolio Organizer. CSV Data Templates let you create a template for the data you are importing so that you do not need to tell Stock Portfolio Organizer how to interpret the data each time you want to import your trades.
What is a Alert?
Alerts give you the ability to be notified when something changes. Alerts can be created for many different things. For example, you can have a notification for when the price of a trade drops below its stop loss price or you can have a notification for when the profit/loss in a trade group drops below a certain threshold. Alerts are triggered and re-evaluated each time stock prices are updated.