One of the most important things in trading is risk management. After all, a trader can easily lose their entire portfolio with one or two bad trades. In this article we will look at how to use stop losses and position sizing to minimize risk and let your profits run. Usually one would use a combination of excel and various charting software to do this but that can be tedious, complicated and time consuming. As you are about to see we can do this easily with Stock Portfolio Organizer with little effort allowing you to spend more time searching for attractive “setups” or planning your next move. If you find anything in this article confusing I strongly suggest you also watch the risk management video that can be found here.
Position Sizing
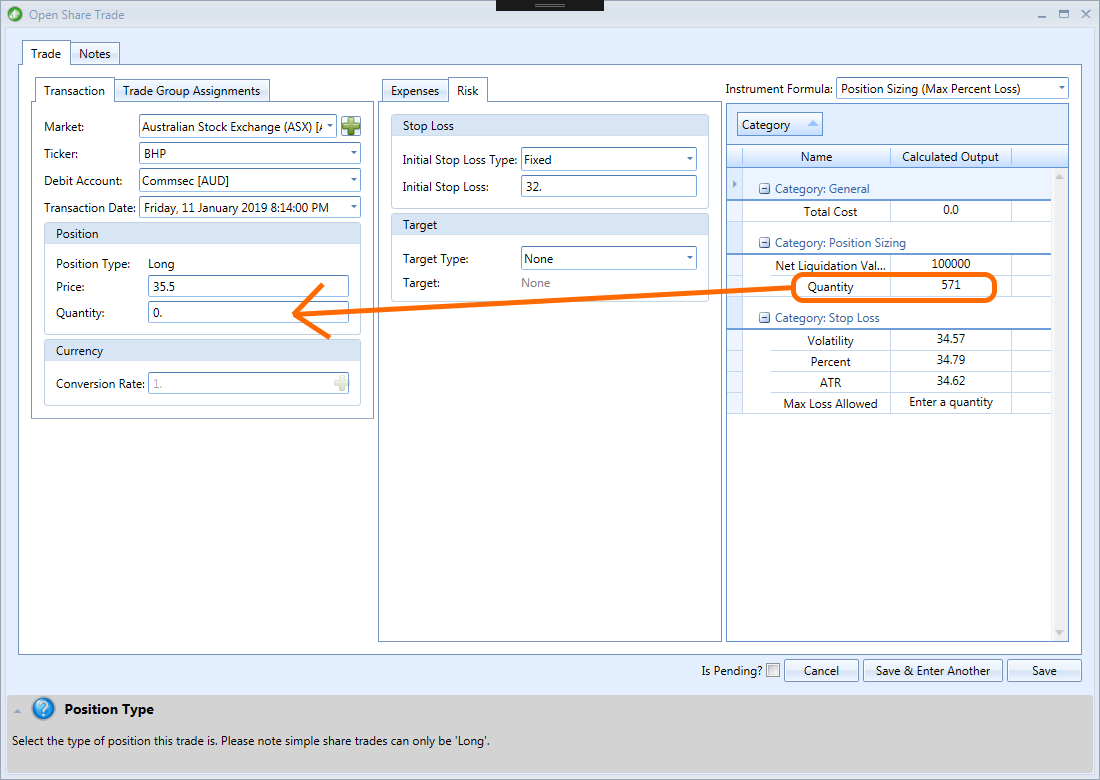
As the name suggests position sizing is about knowing how many shares of a stock to purchase based on an initial stop loss and the maximum percentage loss allowed for the total portfolio. For example, you would like to buy BHP shares which are currently trading at $35.5 and you have worked out that you would like to put a stop loss at $32 and would like to risk no more than 2% of your total portfolio. How do you work out how many shares to purchase? If using Stock Portfolio Organizer, the process is straightforward. Simply open the trade entry window and select the position sizing instrument formula. Then enter the details that you know for the trade, like the current price and your stop loss price, and the quantity will be calculated for you.
Stock Portfolio Organizer does a lot of calculations for you in the background, which would otherwise be very difficult and time consuming using something like excel.
To calculate how many BHP shares to purchase accurately you need to know the total liquidation value of your portfolio and how much trading capital you have available in your account. If your portfolio is currently empty, calculating this figure is relatively simple. It is simply the balance of your account.
What if you have trades currently open? What are they worth? Is it based on the current stock price? This is where things can get a little tricky. Most traders when asked think that for position sizing your liquidation value is calculated based on the current stock price. The correct answer depends on whether your trades have a stop loss or not. If we had calculated the quantity of BHP shares to purchase based on the current market value of our portfolio and subsequently the market fell causing all trades in our portfolio value to drop in value and the stop loss of $32 for our BHP trade was triggered, we would quickly realize that we have lost more than 2% of our portfolio.
So, how should the value of open positions be calculated? Your portfolio value is worth whatever return you will get if all your stop losses are triggered. If your trades don’t have a stop loss, then the current market value will have to suffice. So in this example to keep things simple, we will say that the total portfolio is worth 100k in size. This means you are willing to risk no more than $2000 on this trade. So you should purchase no more than 571 BHP shares. Stock Portfolio Organizer makes the whole process very simple. As mentioned before, once you have entered all the necessary details in the trade entry window the quantity you should buy will be calculated for you. With this calculated quantity you can then save that trade as ‘Pending’ then purchase the desired number of shares on the market, return to Stock Portfolio Organizer and amend the trade to include the actual purchase price.
Stop Loss
One of the rules of good trading, and of good investing in general, is to “limit your losses and let your profits run.” This phrase is often heard in investment circles, but is not often implemented with discipline. It’s another way of saying that to minimize risk and maximize profit one should hold onto a stock only as long as it is climbing and sell quickly when it starts to decline. This can be accomplished with the correct stop loss. A stop-loss is an order placed with a broker to sell a security when it reaches a certain price. Stop-loss orders are designed to limit an investor’s loss on a position in a security. There are two different kinds of stop losses: an initial stop loss and a trailing stop loss. An initial stop loss is the stop loss that is calculated when the trade is first entered and a trailing stop loss is the stop loss that is calculated as the stock price changes. Most traders will have both an initial stop loss and a trailing stop loss that starts at the initial stop loss and follows bellow the price. Stop losses are usually calculated based on some measure of volatility. By using a stock’s volatility in the calculation of the stop loss normal fluctuations in the stock price won’t trigger an exit. This keeps you in the trade as long as possible and extracts the maximum amount of profit by following the trend.
You can also calculate Initial stop losses based on the number of shares you want to purchase using the maximum allowed risk or a percentage of the current price. The most popular measures of volatility used for calculating stop losses are the Average True Range (ATR) and the Standard Deviation.
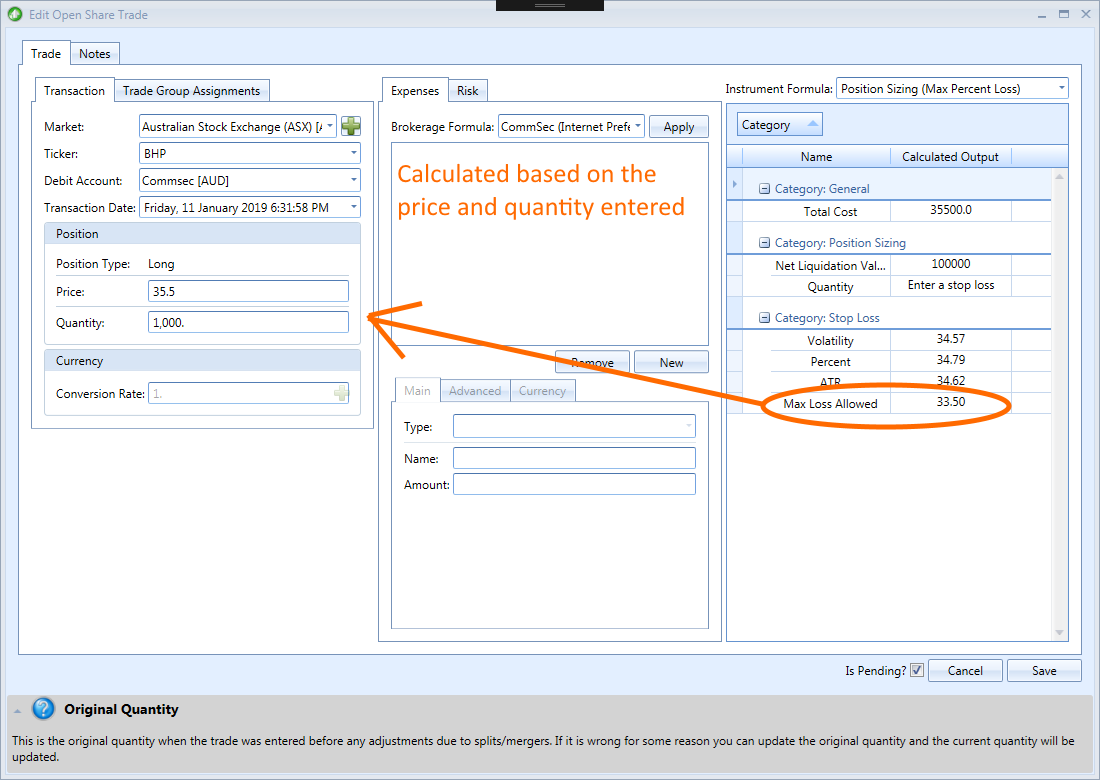
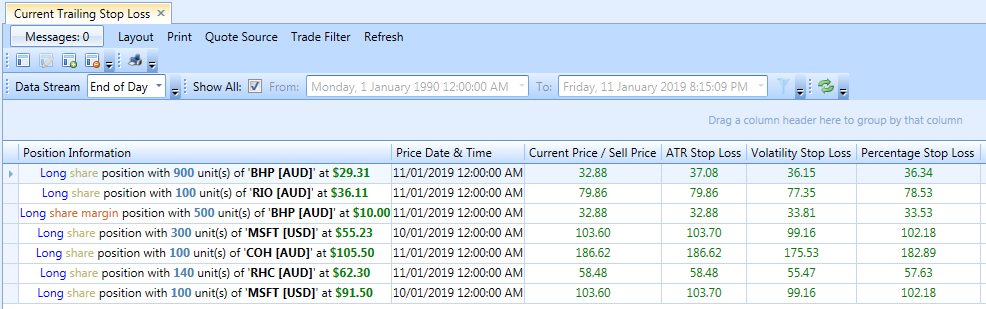
Normally the above is difficult to do in excel or different charting software but very easy in Stock Portfolio Organizer as it can calculate and record the current and initial stop loss for trades using the most popular methods. For example, let’s take our previous BHP trade example and say that we want to purchase 1000 shares and want to calculate what price to put the stop loss at. Like the position sizing example before we simply need to open the trade entry window and select the position sizing instrument formula and enter the details that we know, namely the quantity and current stock price. If we have entered all the required information, the instrument formula should automatically calculate a number of different stop loss prices for us using several different methods. The volatility and percentage based stop losses are not useful to us in this case as they do not take the quantity into consideration. However, the ‘Max Loss Allowed’ is useful so we should use that value as our initial stop loss. In this case the ‘Max Loss Allowed’ stop loss price is $33.5. We can then later calculate the trailing stop loss based on some volatility measurement such as Average True Range (ATR) or Standard Deviation. We can do this by opening the appropriate custom grid view, which should calculate the current trailing stop loss price starting from our initial stop loss of $33.5.
We can then later calculate the trailing stop loss based on some volatility measurement such as Average True Range (ATR) or Standard Deviation by opening the appropriate custom grid view, which should calculate the current trailing stop loss price starting from our initial stop loss of $33.5.
Conclusion
As you can see implementing proper risk management and position sizing for your portfolio is very straightforward with Stock Portfolio Organizer as it takes care of all the complex calculations behind the scenes that would otherwise be difficult and cumbersome letting you focus on other aspects of trading like searching for that winning strategy. You can find a free trial of Stock Portfolio Organizer here.