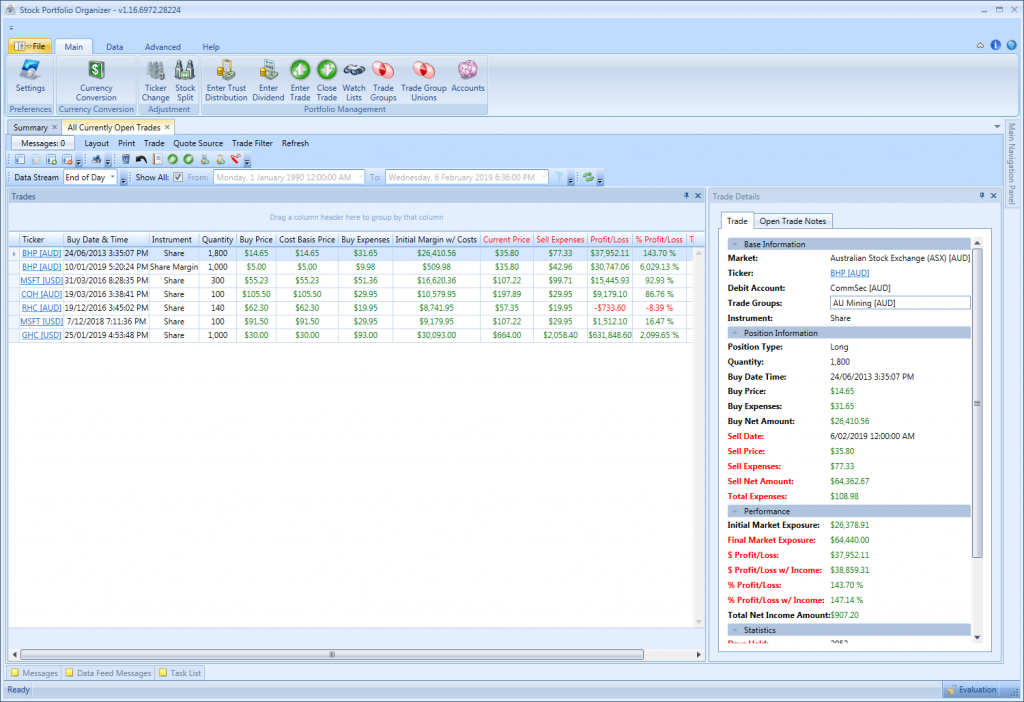
The following screenshot shows your currently open trades. This view can be accessed from the main navigation pane by expanding ‘All Trades’ then clicking ‘Currently Open Trades’.
Here you can see your currently active trades along with their hypothetical gains/losses and market values in red. With a defined brokerage formula these hypothetical performance figures have all your sell-brokerage costs factored in so you can see the performance of your trades if you were to sell them now.
Each grid view in Stock Portfolio Organizer is fully customizable, allowing you to sort, filter and group by any column. Not only that, but you can also add/remove columns to show the data that is important to you. For example, if you wanted to customize the view for risk management, you can easily remove some columns you don’t need and add Original Risk, Value At Risk, Risk/Reward Ratio, Days Held etc. You can then save your changes to a layout for instant recall later.
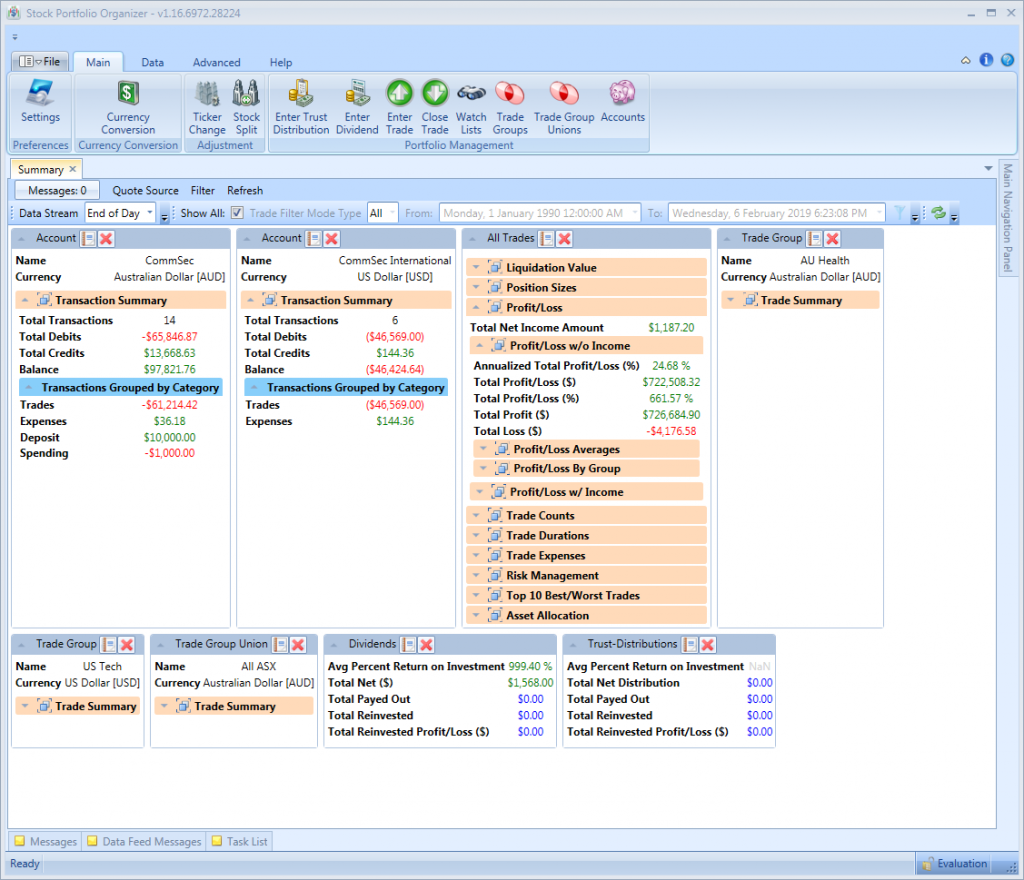
This is the ‘Summary’ view. It is arguably the most important view in Stock Portfolio Organizer as it allows you to view summary statistics for all your trades, accounts, dividends, trust distributions and trade groups.
- Want to find out how your trades performed last year?
- Want to find out what your exposure is by market?
- Want to find out what is the average number of days a winning trade is held?
All this and more is easily accessible in the summary view. There are over 40 different trade metrics for just trades alone. You can also apply various data filtering to get metrics on various groups of trades. For example, you can filter for only short trades to find out what the average number of days a winning short trade is held. The possibilities are endless.
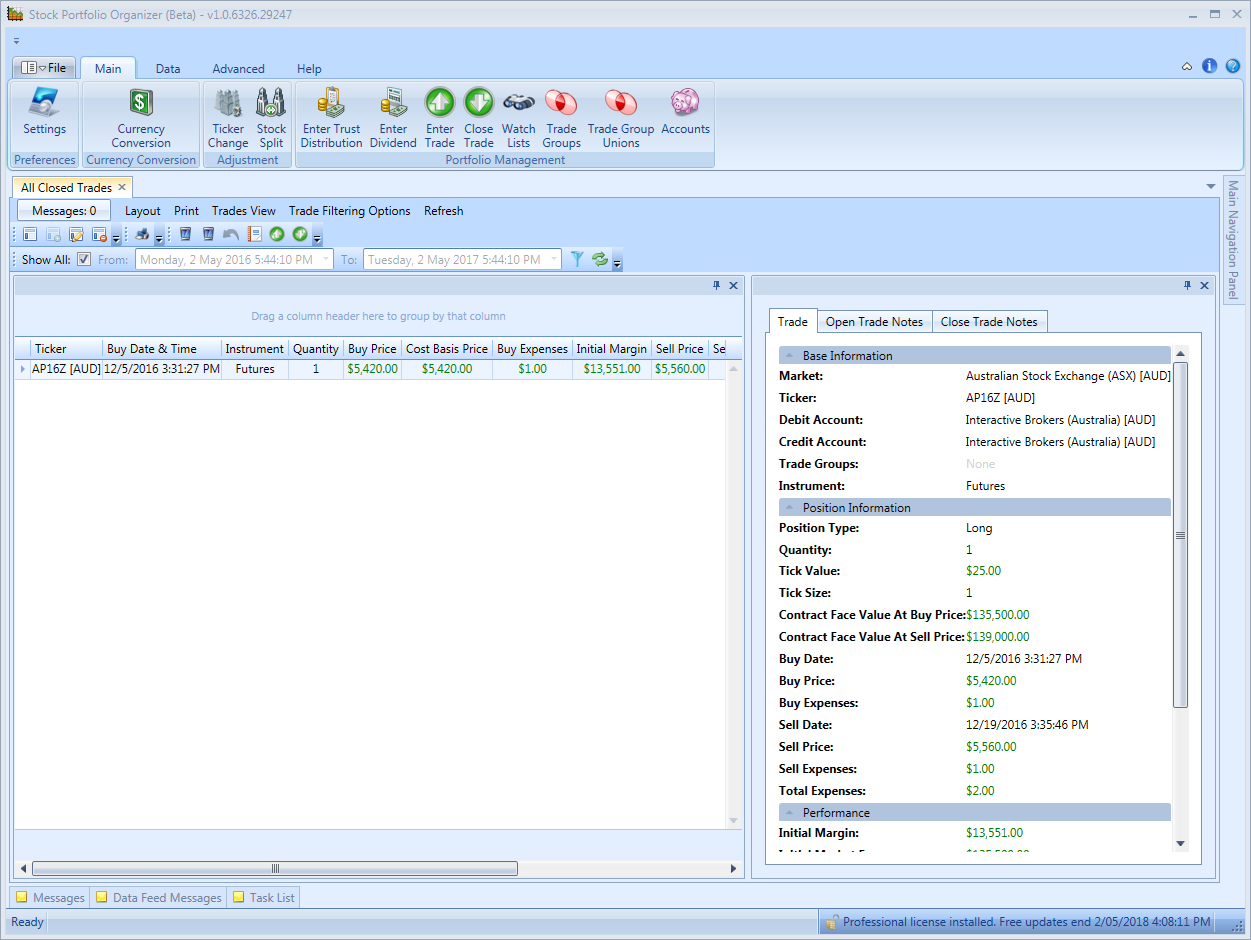
This is the ‘Closed Trades’ view. It shows all of your past trades and how much your profit/loss was for a trade. It is very quick and easy to filter the trades to show only those that you want. This can be very useful for taxation purposes.
Just like the ‘Currently Open Trades’ view, you can customize it to show the data that is important to you.
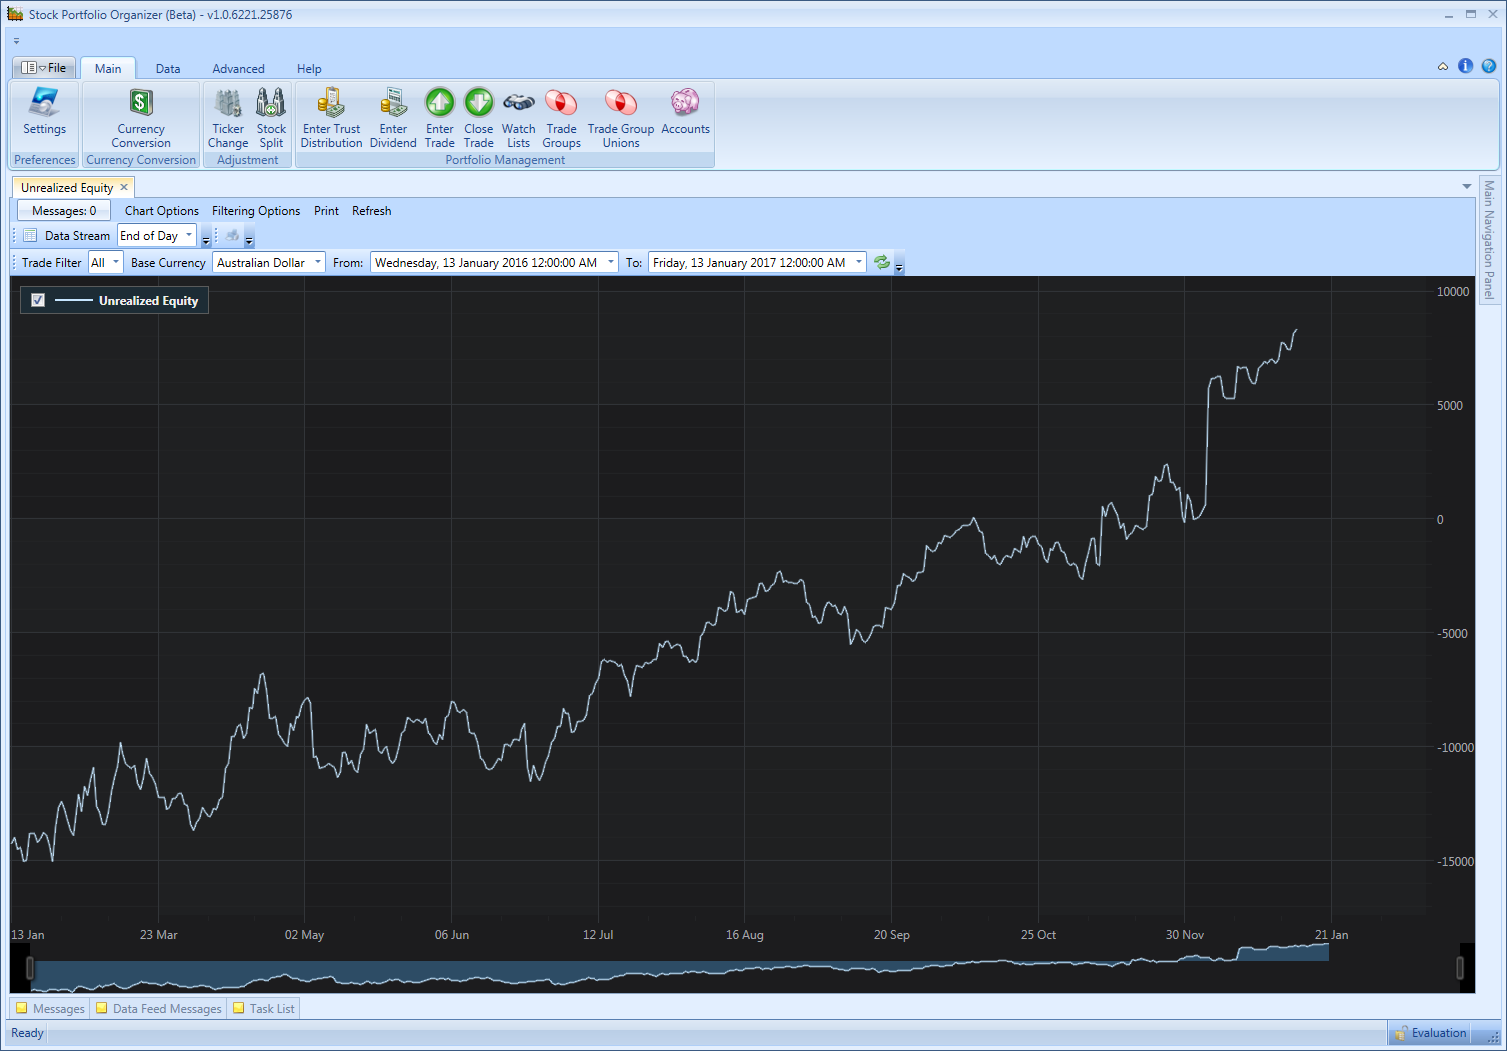
This screenshot shows the growth of your portfolio equity over time. Using the advanced trade filtering options you can chart the equity of just about any group of trades imaginable. For example, you can filter by the instrument type to view the equity curve of your futures or forex trades or you can filter by a watch list called, for example, “Resource Stocks” to visually see how your investments in resource stocks are performing. No other portfolio manager on the market gives you so much flexibility.