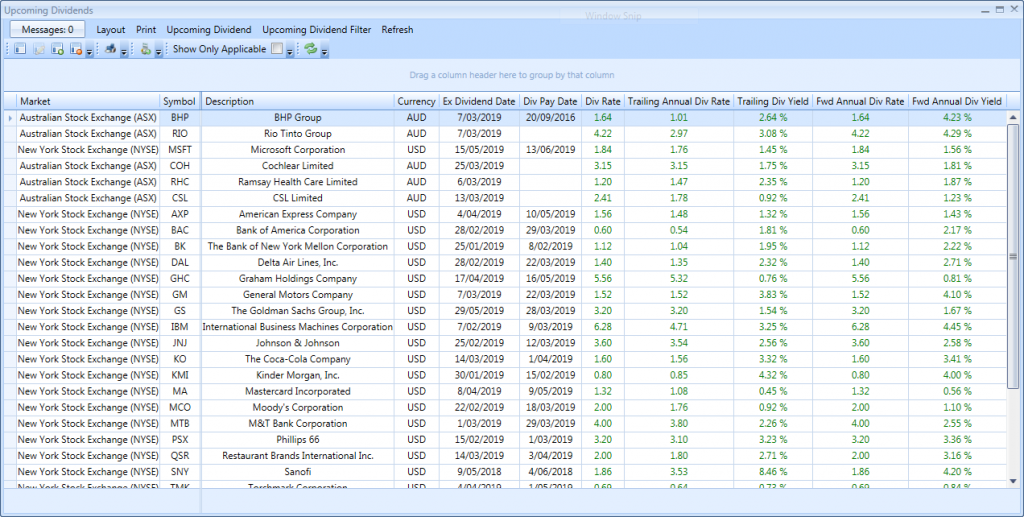
View Upcoming Dividends
The following is a screenshot of the ‘Upcoming Dividends’ view. It allows you to view upcoming dividends for your currently open trades or for the whole market if you want to look for opportunities.
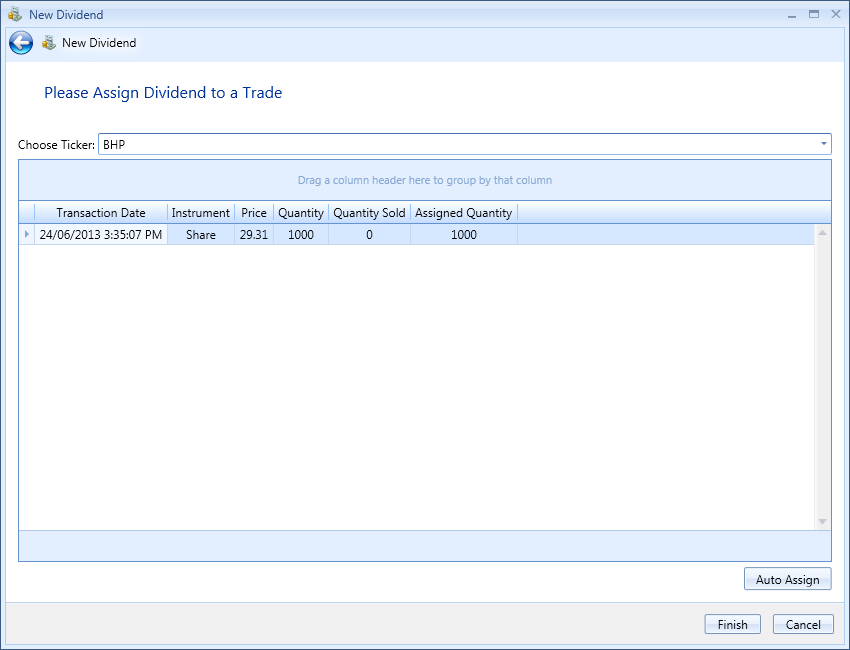
This view also speeds up dividend data entry by allowing you to import any upcoming dividend by simply right clicking on a row and selecting ‘New Dividend’.
Stock Portfolio Organizer can download dividend data for free for all markets. Australians can download dividend data for free from www.sharedividends.com.au and those living in other countries can download dividend data for free from Yahoo Finance.
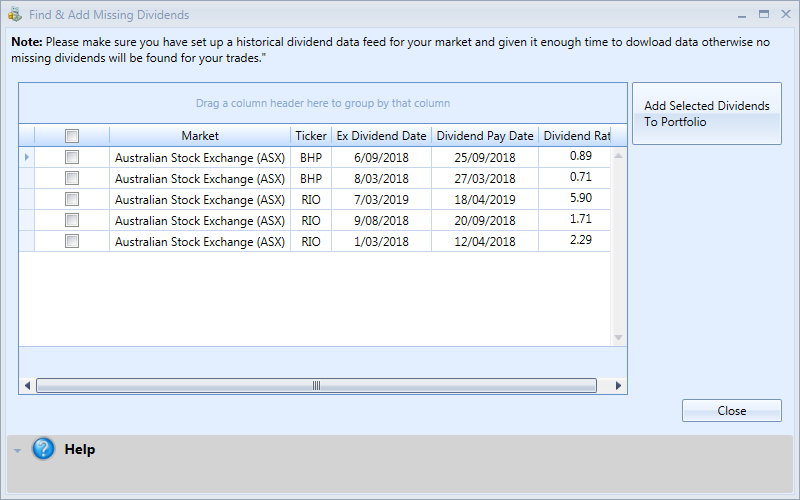
Find & Add Missing Dividends
Since Stock Portfolio Organizer can download dividend data for stocks in your portfolio it can also use that data to determine which dividends have not already been added to your portfolio and add them in bulk. Saving you from having to enter them manually!
Associate Dividends & Trust Distributions With Trades
When entering dividends or trust distributions, you can automatically or manually associate them with trades. This allows Stock Portfolio Organizer to calculate some very useful metrics that you won’t find in other portfolio managers. The following are just some of the useful metrics that Stock Portfolio Organizer can calculate with this information:
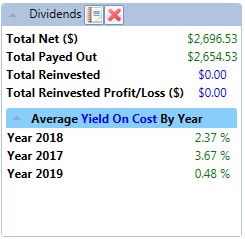
Average Yield On Cost
In the dividends and trust distributions panels found in the summary view, you can find out the average yield on cost. This figure shows the dividend or trust distribution yield of the original investment. If the number of shares owned by the investor does not change, the yield on cost will increase if the company increases the dividend it pays to shareholders; otherwise yield on cost will remain constant.
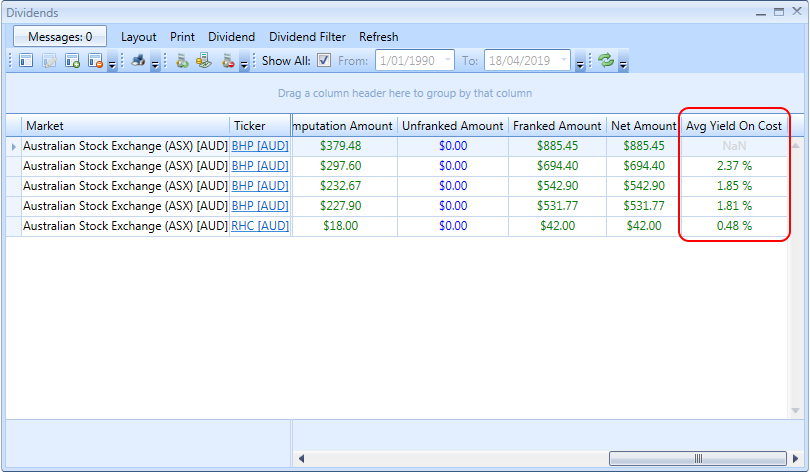
Average Yield On Cost of Dividend or Trust Distribution
In the dividends and trust distribution grid views you can see the average yield on cost of an individual dividend or trust distribution. For example, you purchased a stock many years ago for $30 and received a dividend of $0.89 per share then your average yield on cost would be 2.96%.
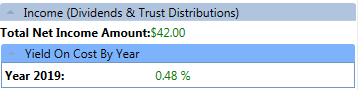
Yield On Cost of Income on Trade
In the trade detail panel, which can be found in any of the trade views, you can see the yield on cost of all income by year.
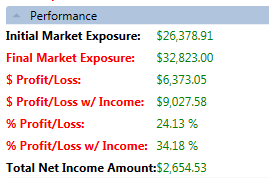
Total Net Income Amount & Profit/Loss Including Income
Another couple of examples of useful metrics is the total net income amount and profit/loss with income, both of which can be found in the trade details panel. These figures tell us how much income (dividends and trust distributions) the trade has earned and what our profit/loss is with any income included in the calculation. Most portfolio management software will only report the simple return, which does not give you the true picture of how your investments are actually performing.