How To Compare & Track the Berkshire Hathaway Portfolio
One of the first things users do when they download our portfolio manager is attempt to import their portfolio into the program. If you have a limited number of trades, it may be possible to manually enter them. For most this is simply not an option. The good news is that Stock Portfolio Organizer has a very powerful data importer. We thought what better way to demonstrate its abilities than to show you how to import the list of assets owned by Berkshire Hathaway from the the Wikipedia entry here and compare it to your own portfolio. Obviously your portfolio will be much smaller :)
Before we start, the first thing you should do is create a new account called ‘Berkshire Hathaway’ and set its currency to USD, this will allow you to keep the Berkshire Hathaway trades separate from your own. Next, you need to create a new trade group called ‘Berkshire Hathaway’ and set its currency to USD. This will allow you to compare the ‘Berkshire Hathaway’ trade group’s performance to other trade groups (If your trades are not assigned to any trade groups you will not be able to do the comparison). You also need to make sure you have the markets NASDAQ, NYSE, TWE entered in the program (If you downloaded Stock Portfolio Organizer when this article was written, they should already be in the database).
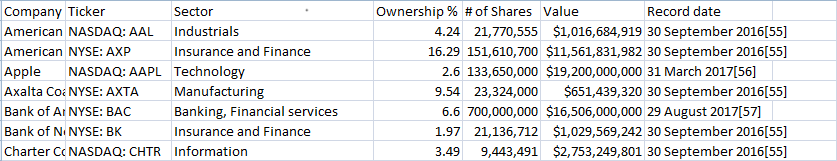
The first step is to open your browser and navigate to the Wikipedia page that has a list of all the assets held by Berkshire Hathaway. Next, select all the data and paste it into excel and save it as a CSV file called berkshire.csv (CSV stands for comma separated values and you can read more about it here). The resulting data should look similar to the picture below. You can also skip this step and download the CSV file Berkshire Hathaway Holdings CSV.
Once we have our data in a CSV file we can import it. To import stock trades via the transaction import wizard the following data is needed at a minimum:
Ticker – The ticker symbol or short code that is used to identify a stock on an exchange. For example, ‘MFST’.
Transaction Date & Time – When the stock was purchased.
Quantity – The number of shares that were purchased.
Price – Price the shares where purchased at.
Transaction Type – Is the transaction a ‘Buy’ or ‘Sell’ order?
Although the above data is the minimum needed to import a trade, there are many other fields that can be included. For example, when importing your own trades you will probably also want to include any brokerage costs. In this case, since the Berkshire Hathaway portfolio contains trades in multiple different markets, we will also need an extra column that contains the name of the market the ticker symbol belongs to.
By looking at the data copied from the Wikipedia entry in excel we can observe a few things. Firstly, the market name and ticker symbol can be found in the ‘Ticker’ column separated by a colon (‘:’). The purchase price is not present in the data for obvious reasons but we should be able to calculate it by dividing the ‘value’ column by the ‘# of shares’ column. Commas and dollar symbols will need to be removed from certain columns to allow the numbers to be parsed. The ‘Record date’ column has ‘[55]’ at the end of each date but this won’t be a problem as the importer will be able to extract the date anyway.
As you can see the data needs some pre-processing e.g. Split the ‘Ticker’ column to get the market name and ticker symbol (short code that is used to identify a stock on an exchange e.g. ‘MFST’) separately, remove commas and dollar symbols in the numbers etc. Normally with other programs you will need to edit this data manually or perform some excel wizardry to get it into the correct layout and format. Doing it manually or in excel can be very time consuming, it is not reusable and has many limitations. In Stock Portfolio Organizer this data pre-processing can be done automatically by creating a ‘CSV Data Template’ for your data, which uses formulas to make changes to the data. So in this case we will need to create a ‘CSV Data Template’ to ‘massage’ the data a bit so that it is understood by the importer. You can create a ‘CSV Data Template’ from the ‘CSV Data Templates’ window and call it ‘Birkshire Hathaway Wikipedia’. Your ‘CSV Data Template’ will need to do the following:
- Split the ‘Ticker’ column on the colon character and create two new columns called ‘Market’ and ‘Symbol’ and specify the field type as ‘Market’ and ‘Symbol’ respectively.
- Process ‘# of shares’ column to remove the commas and specify the field type as ‘Quantity’.
- Compute the price by using the ‘value’ and ‘# of shares’ columns’ and specify the field type as ‘Price’.
- Create a new column to contain the transaction type, in this case all the values should be ‘B’ which is short for buy and specify the field type as ‘Transaction Type’.
- Specify the field type for the ‘Record date’ column as ‘Transaction Date & Time’. Note: Some users have asked how does the program know what format the date is in? In 95% of cases the date and time can be automatically extracted without specifying the format. There are some ambiguous cases that may need a hint. For example, the date 2/2/2012 can be interpreted as either d/m/yyyy or m/d/yyyy depending on the country. In these cases you can pass a special parameter to the importer ‘US’ or ‘UK’ to resolve this ambiguity. This parameter can be passed to the importer in one of two ways. By putting ‘US’ or ‘UK’ in the ‘Parameter Value’ field in a CSV Data Column or via the column name. For example, if you rename the column name from ‘Record date’ to ‘Record date[UK]’ the parser will interpret ambiguous dates as being in the UK format where the day appears before the month.
Each column in your CSV Data Template can use a modified JavaScript language that has access to two variables: the current columns value called ‘value’ and an array of all the values in the current row called ‘row’. By using these two variables all the above needed modifications to the data can be easily achieved with only a few lines of code for each column. We won’t go into all the steps needed to create the ‘CSV Data Template’ but you can download the completed version here and import it into Stock Portfolio Organizer. You can download the Berkshire Hathaway CSV Data Template and import it from the ‘CSV Data Templates’ window.
With the CSV Data Template in hand we can open the Transaction Import Wizard window – select the CSV Data Template we created above and the CSV file with the Berkshire Hathaway assets and click the ‘Run’ button. After clicking the ‘Run’ button the Transaction Import Wizard window should look as follows:
![]()
If you look at the result in the ‘Data Preview’ tab, you may notice that the data has changed in some columns and that there are several new columns such as ‘Price’. If you open the ‘Data Column To Field Type Assignments’ tab, you can see what a specific column in our data represents. This was all done by the chosen CSV Data Template. If, when importing your own trades, you are not using a CSV Data Template, you will have to specify what each column of data represents yourself. If everything looks good, simply click ‘Next’ and you should see the following page:
![]()
On this page you can select some default preferences. For example, if your data does not contain the market name you can specify a default market here. In this case our data contains the market name so just pick any market as the default one. The same goes for the Fx Market option. Click ‘Next’ to continue importing the data. If there were no problems with the data import you should end up on the following page of the Transaction Import Wizard:
![]()
Remember that Account, Trade Group and Brokerage Formula we created earlier? You need to select them here and leave all other values at their defaults. Once you are done click ‘Next’. You should see the following page:
![]()
On this page you need to select the market object that corresponds to a particular market name. Once you have completed that step click ‘Next’. You should end up on the following page:
![]()
On this page you need to select the ticker object that corresponds to a particular symbol. If the ticker object has the same symbol name as your data, the correct ticker object will be automatically selected. If there are no ticker objects that correspond to a particular symbol, you should check the ‘Create Missing Tickers’ option so that they can be created automatically. In this case you need to select ‘Create Missing Tickers’ and click ‘Next’. You should be greeted with the following page:
![]()
On this page you can edit various details on each trade individually. For importing the Berkshire Hathaway trades we don’t need to do anything here so simply click ‘Next’. You should see the following page:
![]()
If you remember on an earlier page there was an option called ‘Close Trade Assignment Strategy’. That option specifies how the importer should match open trades to their corresponding close trades. On this page you can customize those assignments. For this example there are no close trades so click ‘Next’ to continue importing. You should see the following final page:
![]()
This page allows you to view/edit any currency conversion values before the trades are finally imported. Click ‘Finish’ to begin importing the Birkshire Hathaway portfolio. If everything was successful, you can view the list of trades in the Berkshire Hathaway portfolio by locating the ‘Berkshire Hathaway’ trade group in the ‘Main Navigation Panel’ and clicking on the small grid icon next to the ‘Currently Open Trades’ item. This should open the following view with all the Berkshire Hathaway positions:
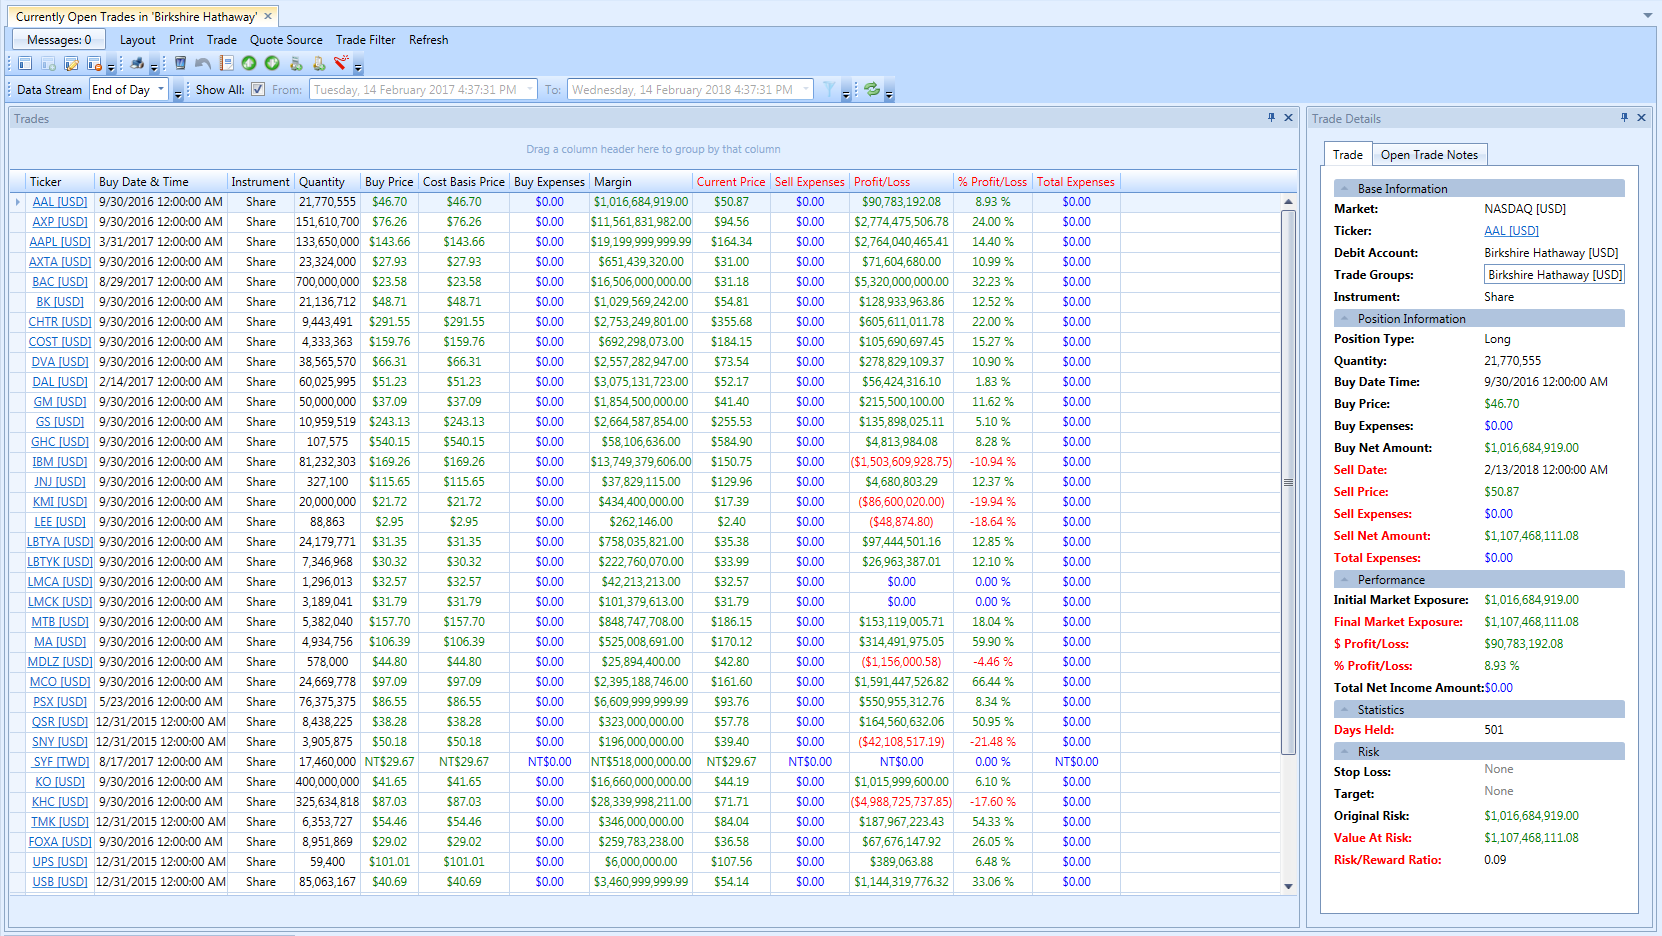
In this view you will be able to see the current profit/loss for each trade as well as other statistics. If your view is showing $0 profit/loss for all the trades, this means one of two things. Either you have not setup a data feed for the NASDAQ, NYSE and TWE markets or the data feed engine still hasn’t downloaded the data. You can also try triggering the data feed manually so it fetches the prices as soon as possible.
If you have made it this far, congratulations. We can now compare how your portfolio stacks up against the Berkshire Hathaway portfolio. To do this simply open the ‘Summary View’ from the ‘Main Navigation Panel’ and now you can compare the statistics of the trade group with your trades vs the ‘Berkshire Hathaway’ trade group. At the time of writing the the Annualized Total Profit/Loss of the Berkshire Hathaway portfolio was a little over 5% with 76% percent of trades profitable.